Real user monitoring (RUM) with grafana cloud 🌐✨
In this article, we will explore the concept of observability and delve into the benefits it offers for web applications

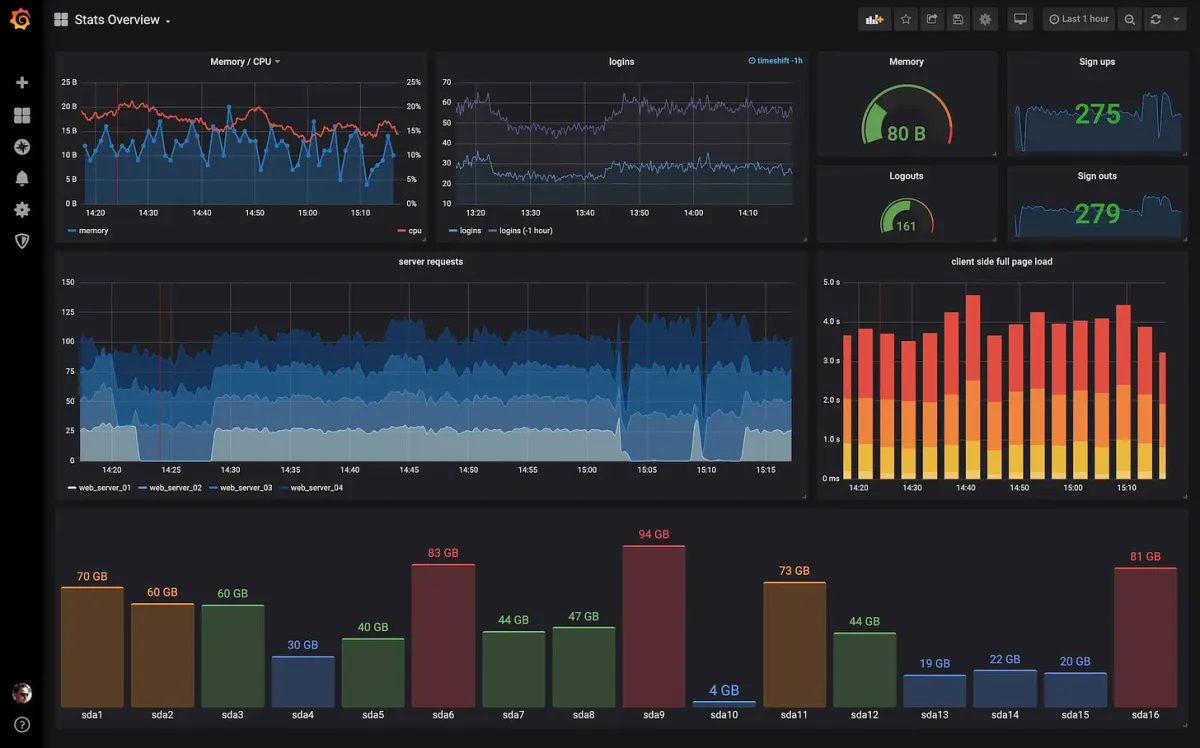
Table of content
- Introduction
- The Power of Observability
- Benefits of Observability for Web Applications
- Introducing Grafana Cloud Frontend Observability
- Key Features of Grafana Cloud Frontend Observability
- Conclusion
Introduction
In today's fast-paced digital world, web applications have become integral to our daily lives. Whether it's shopping online, accessing financial services, or connecting with others on social media, web applications play a significant role in how we interact with the digital landscape.
As the complexity of web applications continues to grow, ensuring a seamless user experience becomes a critical aspect for businesses to succeed. This is where observability comes into play.
Observability is a key concept in modern software development and operations, providing developers and IT teams with real-time insights into the performance and behaviour of their applications and infrastructure.
It goes beyond traditional monitoring and empowers teams to identify and resolve issues proactively, leading to improved reliability, faster incident response, and enhanced customer satisfaction.
In this article, we will explore the concept of observability and delve into the benefits it offers for web applications. We will also introduce grafana cloud frontend observability, a hosted service that takes observability to the next level, providing real user monitoring (RUM) insights and enabling businesses to gain a comprehensive understanding of their end users' experiences.
The Power of Observability
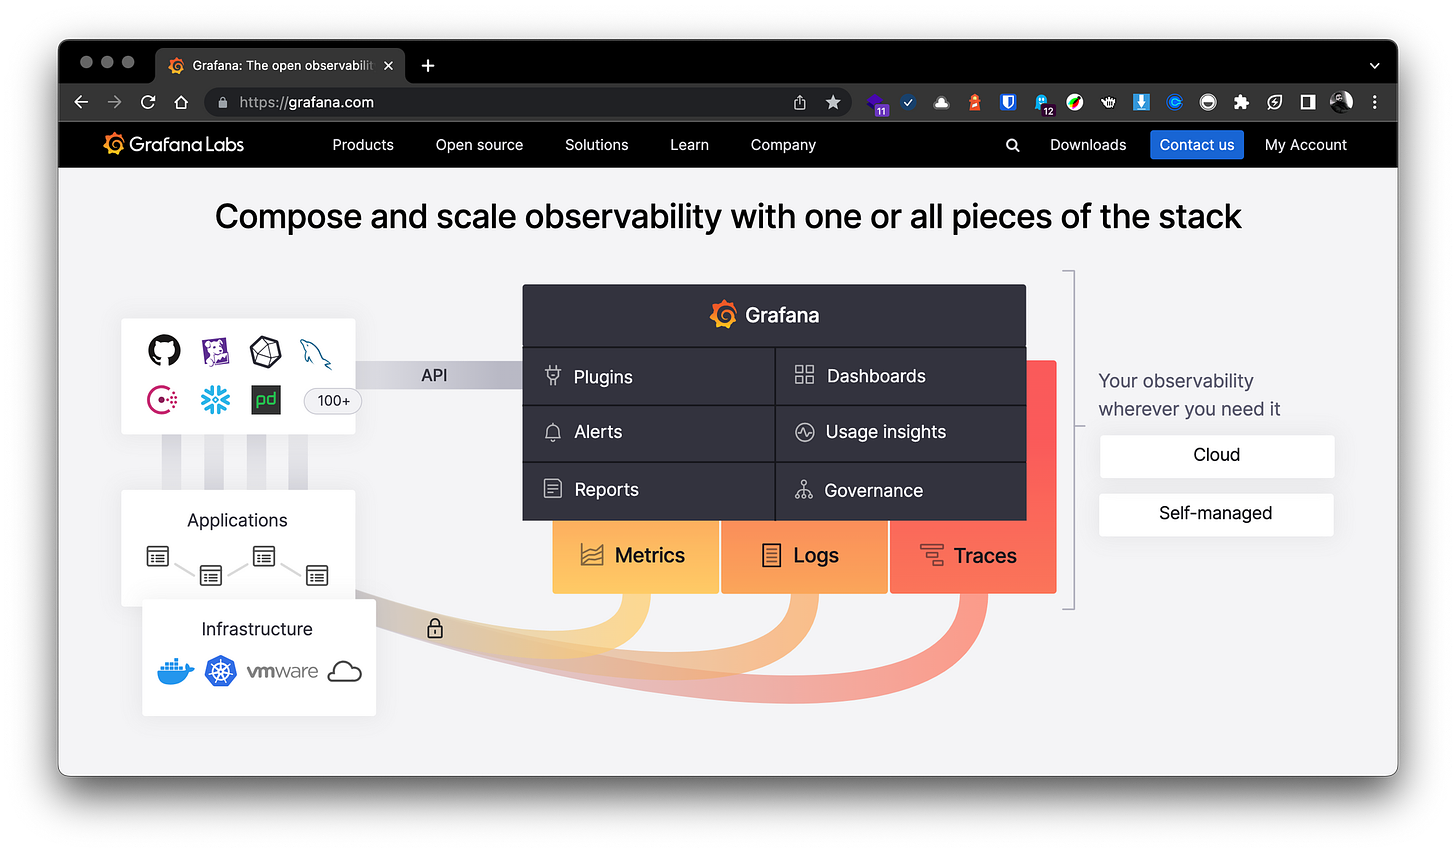
Observability is a multi-faceted approach that allows developers and operations teams to gain deep insights into the behaviour of complex systems like web applications. Unlike traditional monitoring, which primarily focuses on collecting metrics and detecting failures, observability encompasses three core pillars: logs, metrics, and traces.
Logs: Logs provide a detailed record of events, errors, and activities within a system. By aggregating and analysing logs, teams can gain valuable context about the inner workings of their applications, helping them pinpoint issues, track user actions, and troubleshoot problems effectively.
Metrics: Metrics are numerical data points that measure specific aspects of an application's performance, such as response times, CPU utilisation, or memory usage. Monitoring and analysing metrics allow teams to detect anomalies, identify performance bottlenecks, and make data-driven decisions for optimising their applications.
Traces: Traces provide a detailed view of the interactions between different components of an application. They help visualise the flow of requests and responses, enabling teams to identify the root cause of issues and optimise the end-to-end performance of their systems.
Benefits of Observability for Web Applications
✅ Enhanced User Experience: With observability, teams can gain real-time insights into how end users are experiencing their web applications. This helps identify performance bottlenecks, errors, and other issues that could affect the user experience. By proactively addressing these issues, businesses can ensure a seamless and satisfactory user experience.
✅ Faster Incident Response: Observability enables teams to detect and respond to incidents quickly. With comprehensive visibility into application behaviour, teams can identify anomalies and potential problems early on, allowing them to resolve issues before they escalate and impact users.
✅ Root Cause Analysis: When issues arise, identifying the root cause is crucial for efficient problem resolution. Observability tools like logs and traces provide valuable context, making it easier to pinpoint the exact cause of an incident and take appropriate corrective actions.
✅ Data-Driven Decision Making: Observability empowers teams with data-driven insights. By analysing metrics and logs, teams can make informed decisions about resource allocation, infrastructure scaling, and application optimisation, leading to improved overall performance and cost efficiency.
Introducing Grafana Cloud Frontend Observability
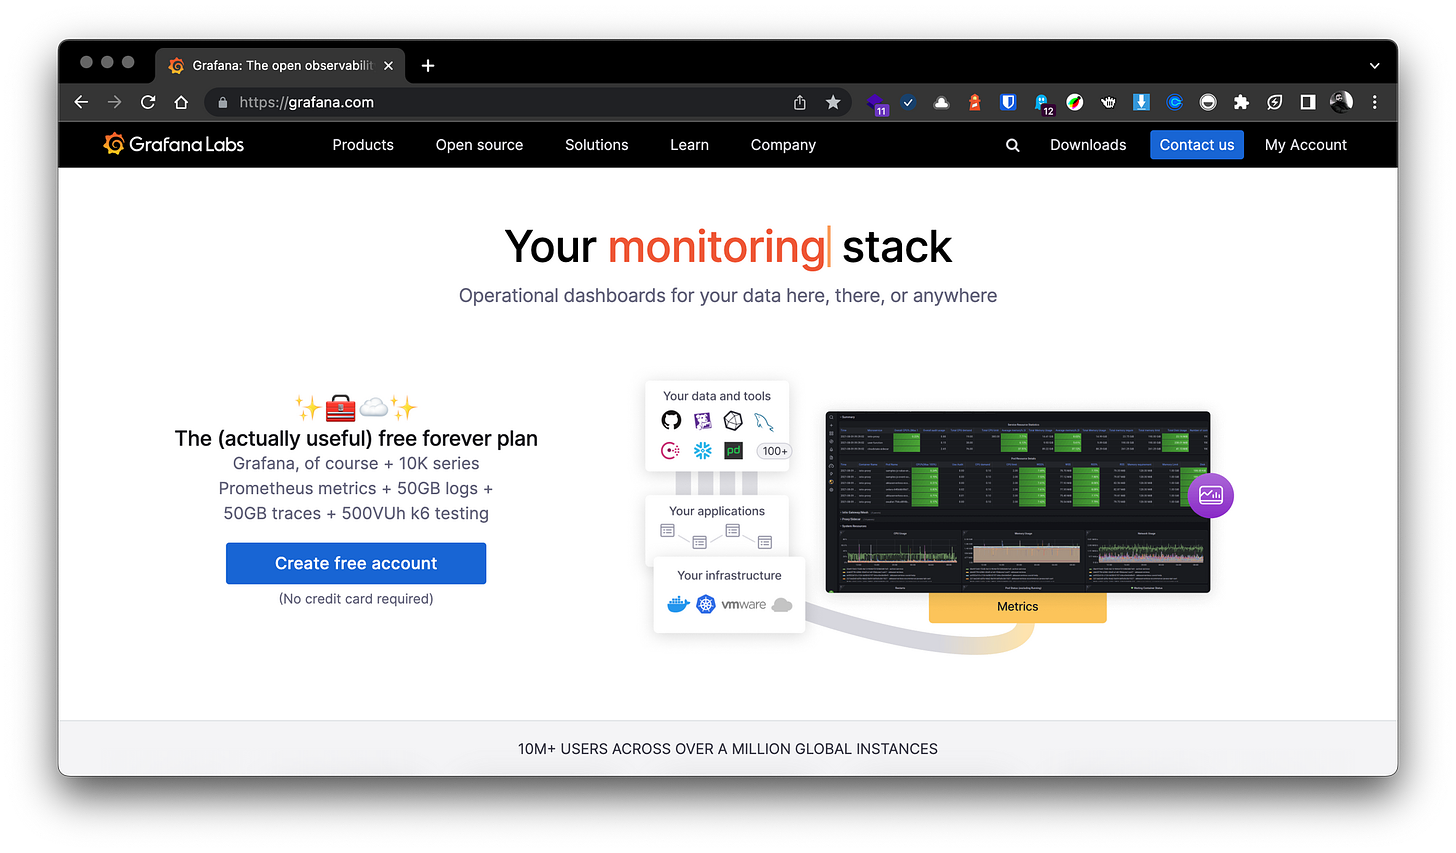
To fully embrace the power of observability, grafana Labs introduces grafana cloud Frontend observability, a hosted service for real user monitoring (RUM). Frontend observability extends the capabilities of the grafana stack, providing developers and IT teams with immediate, clear, and actionable insights into the real end user experience of their web applications.
Key Features of Grafana Cloud Frontend Observability
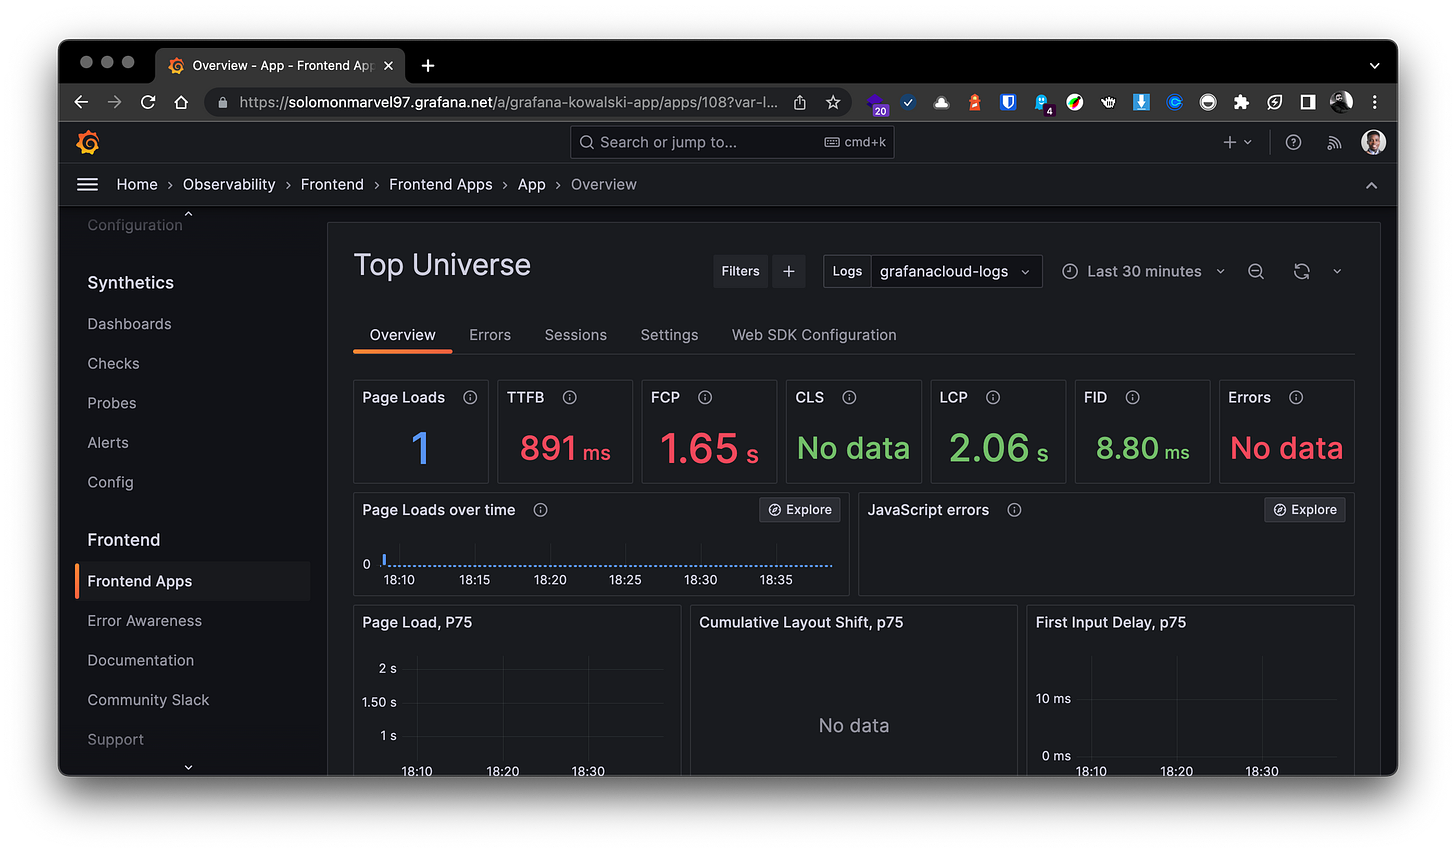
✅ Monitor Frontend Health: Frontend observability allows teams to monitor the health of their web applications in real-time. It measures and reports on web vitals, such as Time to First Byte (TTFB), Largest Contentful Paint (LCP), First Input Delay (FID), and Cumulative Layout Shift (CLS), providing an immediate understanding of the actual end user experience.
✅ Resolve Frontend Errors: The frontend of a web application can produce errors that are challenging to track and resolve. Frontend observability automatically groups errors based on similarities, ranks them by volume and frequency, and provides contextual metadata for faster troubleshooting.
✅ Investigate Frontend Issues: Frontend observability helps teams investigate frontend issues with end-to-end visibility. It tracks user sessions and reconstructs specific timelines of events leading up to any issue. The user sessions are correlated with backend requests, providing rich context for root cause analysis.
✅ Query and Correlate Telemetry: Frontend observability stores data in grafana cloud logs, powered by grafana loki, and uses LogQL for queries. This enables teams to correlate frontend performance data with other application and infrastructure performance data, providing a holistic view of software performance.
Conclusion
Observability is a fundamental aspect of modern web application development and operations. By embracing observability, businesses can gain real-time insights into their applications' performance, troubleshoot issues proactively, and ensure a seamless user experience.
With grafana cloud frontend observability, developers and IT teams have access to a powerful toolset for real user monitoring, enabling them to optimise their web applications and deliver exceptional digital experiences.
To learn more about grafana cloud frontend observability and start your journey to enhanced observability for your web applications, sign up for a free account and explore the power of real user monitoring today. 👇🏾👇🏾👇🏾